EXECUTIVE SUMMARY
• EV Market 2025: BYD overtakes Tesla (2.26M
vs 1.64M Battery Electric Vehicle (BEVs)) | 30M+ global EV sales | China 60%
market share
• Battery Supply: $15.8B raw materials spend
| Lithium-nickel-cobalt demand surging | China 90%+ processing dominance
• Renewable Energy: 4,600 GW capacity
additions by 2030 | Solar 80% of growth | Renewables to overtake coal in
2025-2026
• Nuclear Renaissance: SMRs emerging | 312.5 MW→912.5 MW by 2030 | First commercial deployments starting
Part 1: Electric Vehicles – The Reality Check
Market Shake-Up: China's BYD Dethrones Tesla
In 2025, the global EV market witnessed a
historic power shift: BYD sold 2.26 million battery electric vehicles, crushing Tesla's 1.64 million
deliveries and claiming the crown as the world's largest EV manufacturer. This
marks Tesla's first annual sales decline (down 9%) and ends its multiyear
dominance. BYD's victory wasn't
just about volume, it reflects a strategic master class in affordability,
diversification, and global expansion.
The table below captures the top four
global electric vehicle manufacturers by sales volume in 2025, highlighting a
historic shift in market leadership. The data shows each manufacturer's market
share, year-over-year growth trajectory, and their relative positioning in a
rapidly expanding global EV market that surpassed 30 million total units in
2025.
|
Manufacturer |
Market Share |
YoY Growth |
|
|
BYD
(China) |
2.26M BEVs |
19.9% |
+28% |
|
Tesla
(USA) |
1.64M BEVs |
7.7% |
-9% |
|
Geely
(China) |
845K |
5.6% |
+238% |
|
VW Group |
420K |
2.8% |
+32% |
Total Global EVs (including PHEVs): 30+ million units sold in 2025 (+20% YoY)
Inside an EV: Critical Battery Components
EV batteries are technological marvels and
supply chain nightmares. A typical lithium-ion battery pack contains:
|
Component |
Function |
Supply Concern |
|
Lithium |
Powers energy storage in the cathode, with most global
demand now driven by batteries |
China dominates refining and processing |
|
Nickel |
Increases energy density, enabling longer driving ranges |
Indonesia's export policies and tight supply create price
volatility |
|
Cobalt |
Ensures battery stability and longevity |
The majority comes from the Democratic Republic of Congo,
raising persistent ethical concerns about mining practices |
|
Graphite |
Serves as the anode material |
China controls nearly all processing capacity, creating
strategic supply risks |
|
Manganese |
Provides structural integrity and power output |
Global supplies remain constrained |
EV Costs: The Path to Price Parity
Battery pack prices have dropped
dramatically over the past decade, approaching the critical threshold where EVs
can compete with gasoline vehicles on price alone without subsidies. In China,
entry-level electric models already cost less than comparable gas cars, proving
that scale manufacturing can deliver affordable EVs.
Western markets tell a different story.
The expiration of federal tax credits and high tariffs on Chinese imports
protect domestic manufacturers but keep consumer prices elevated. The result:
EVs remain premium purchases in the US and Europe, while China has achieved
genuine mass-market adoption. The path to affordable EVs exists but policy and
trade barriers determine who gets to drive it.
Part 2: Renewable Energy – The Future is Solar (and Wind, and Nuclear)
The Solar Surge: 4,600 GW by 2030
Global renewable power capacity is set to
double by 2030, adding 4,600 GW equivalent to combining China, the EU, and
Japan's entire power generation capacity. Solar photovoltaic accounts for 80%
of this growth, driven by plummeting costs (now the cheapest new generation in
most countries), faster permitting, and broad social acceptance.
|
Renewable Milestone |
Status / Projection |
|
Renewables overtake coal as largest electricity source |
End of 2025 / Mid-2026 |
|
Renewable share of global electricity generation |
32% (2024) → 43% (2030) |
|
Solar PV capacity growth 2025-2030 |
More than
doubles |
|
732 GW (+45% vs 2019-2024) |
|
|
140 GW (2025-2030) |
|
|
China's share of global renewable additions |
60% |
Source: IEA Renewables 2025 Report
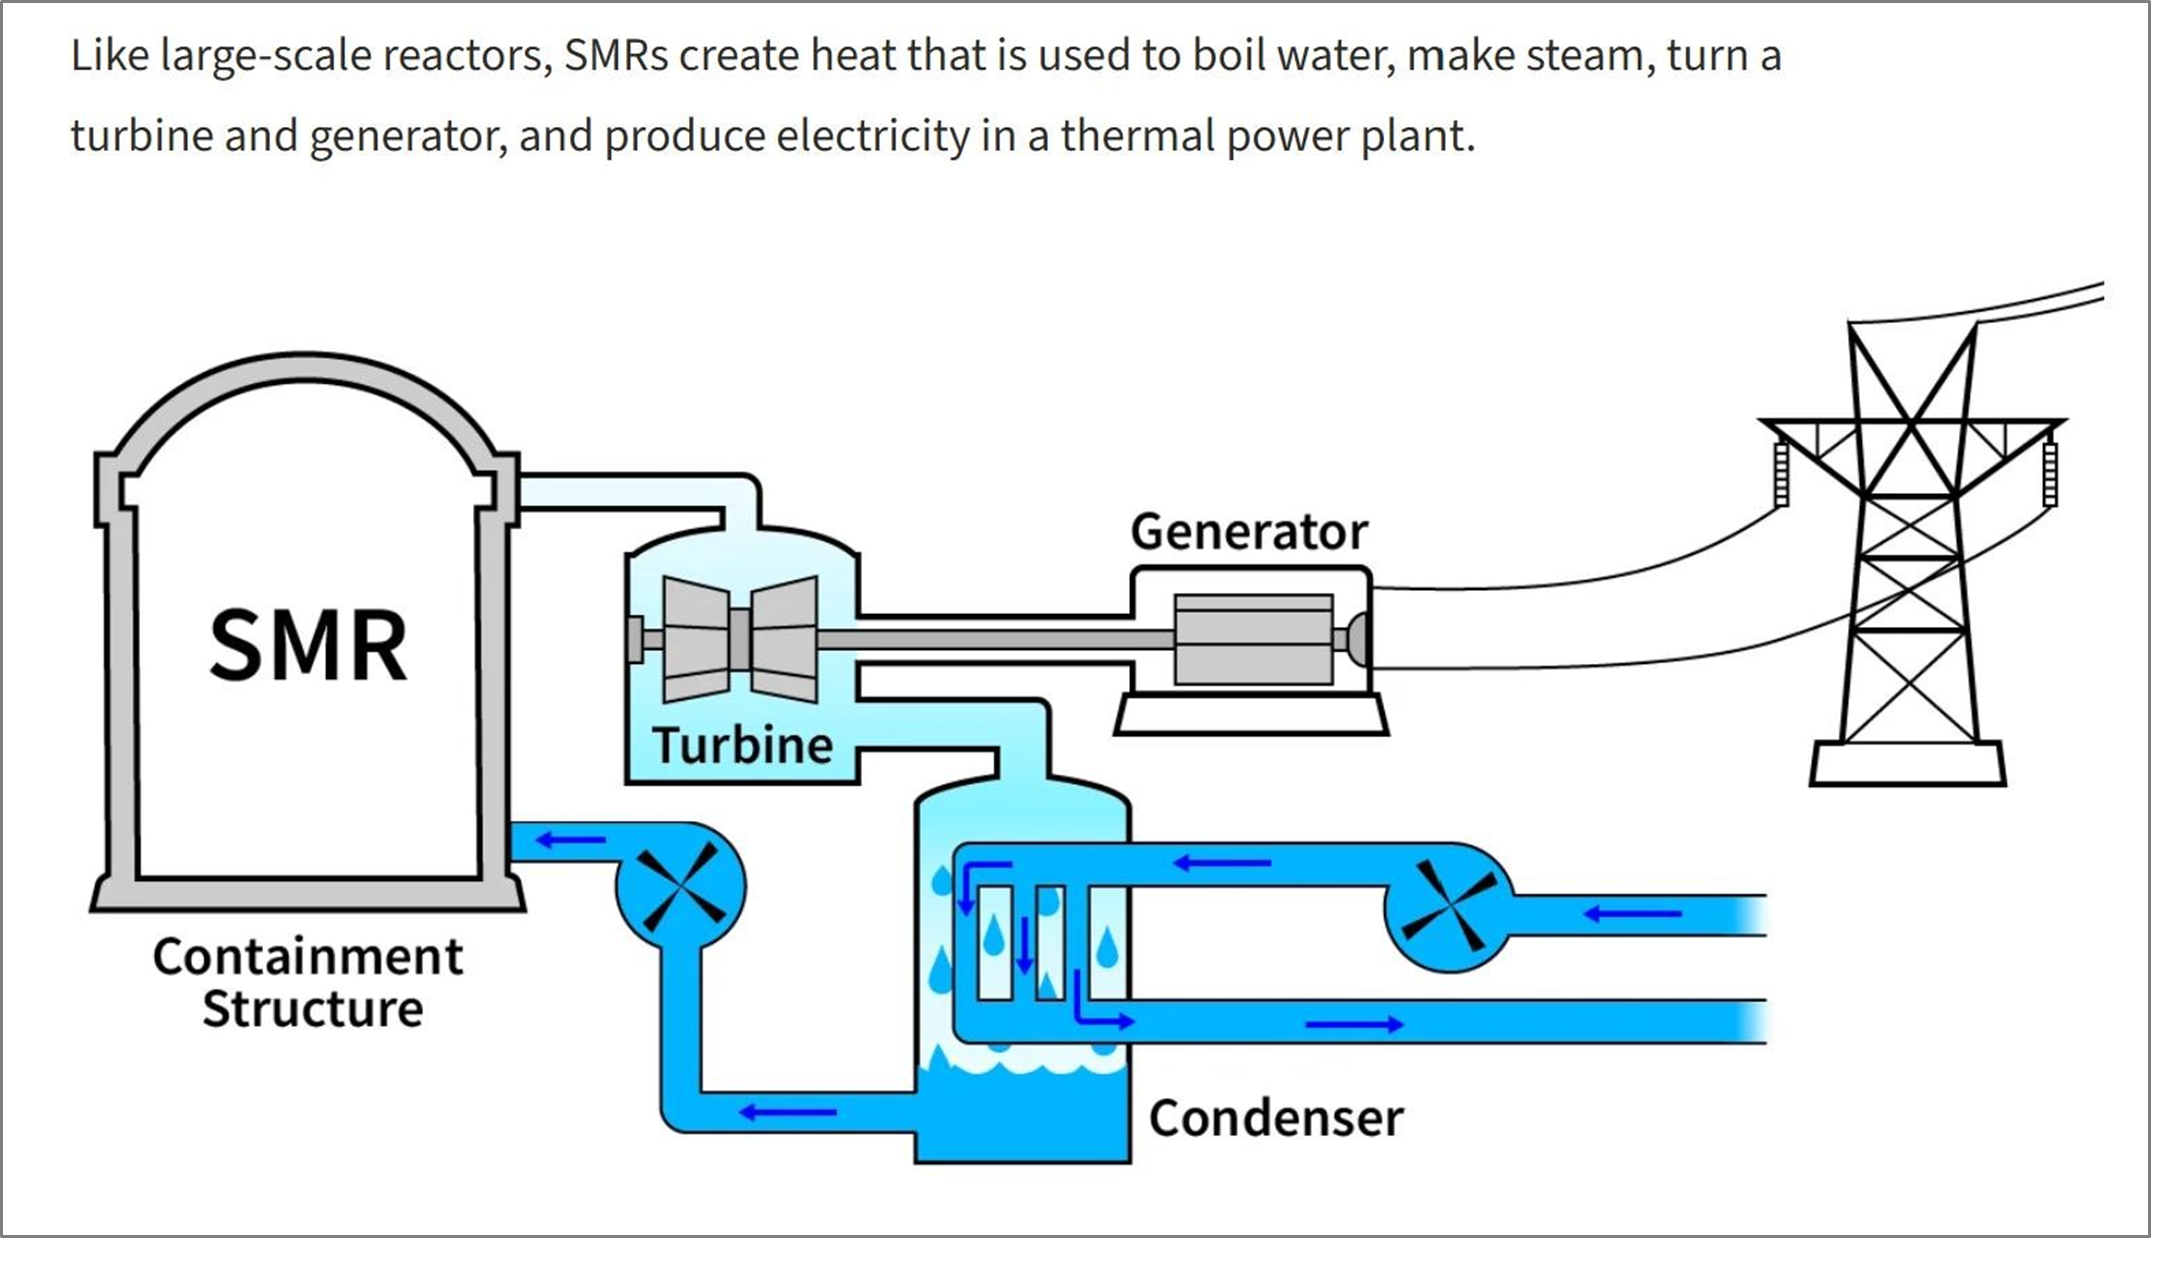
Nuclear Renaissance: Small Modular Reactors (SMRs)
While renewables dominate headlines,
nuclear energy is experiencing a quiet renaissance. Over 40 countries now
support nuclear expansion, driven by energy security concerns and 24/7 baseload
needs that intermittent renewables can't meet alone. The gamechanger: Small
Modular Reactors.
What are SMRs?
Factory-built reactors (50-350 MW
capacity) that are smaller, simpler, and faster to deploy than conventional
nuclear plants.
Key advantages: 60% lower capital costs, 24–36-month construction timelines, passive safety systems, and suitability for remote locations or industrial facilities.
 Source: https://understand-energy.stanford.edu/news/understand-small-modular-reactors
Market Trajectory: SMR installed capacity: 312.5 MW (2025) → 912.5 MW (2030)
at 23.9% Compound Annual Growth Rate (CAGR). First
commercial projects coming online 2030 (TerraPower Natrium in Wyoming, X-energy
Xe-100 at Dow Seadrift). Tech giants are major customers: Google signed 500 MW
with Kairos Power; Amazon investing in Xenergy and Energy Northwest projects
totalling 5 GW.
The Nuclear-Renewable Synergy: Nuclear provides baseload stability; renewables provide variable capacity. Together, they enable deep decarbonization. IEA projects nuclear capacity must reach 1,160 GW by 2050 (from 394 GW in 2020) to meet 1.5°C climate targets. SMRs bridge the gap where large reactors face public opposition or insufficient grid capacity.
The Integration Challenge: EVs, Grids, and Renewables
Here's the trillion-dollar
question: How do we power 30 million+ EVs with clean electricity when solar/wind are intermittent and grids are
constrained? The
answer involves three simultaneous transformations:
1. Grid Expansion
UK example: Scotland generates most wind
power; demand is in the south.
Result: £1.4B paid to wind farms in 2023
to NOT produce electricity due to transmission constraints. UK grid operator
estimates £40B/year investment needed through 2030. US, EU face similar
bottlenecks.
2. Energy Storage
Battery storage deployment hit 1 TWh
capacity in 2025. Pumped hydro (using excess renewable power to pump water
uphill, then generating electricity on demand) growing 80% faster 2025-2030 vs
previous period. Vehicle-to-grid (V2G) technology turns EV batteries into
distributed storage but requires bidirectional charging infrastructure rollout.
3. Flexible Baseload
Natural gas provides dispatchable power but emits CO2. Nuclear (including SMRs) provides carbon-free baseload. Hydrogen electrolyzers can absorb excess renewable generation, producing green hydrogen for industry/transport. Geothermal (projected to triple by 2030) offers 24/7 renewables.
Benefits vs. Challenges: The ESG Scorecard
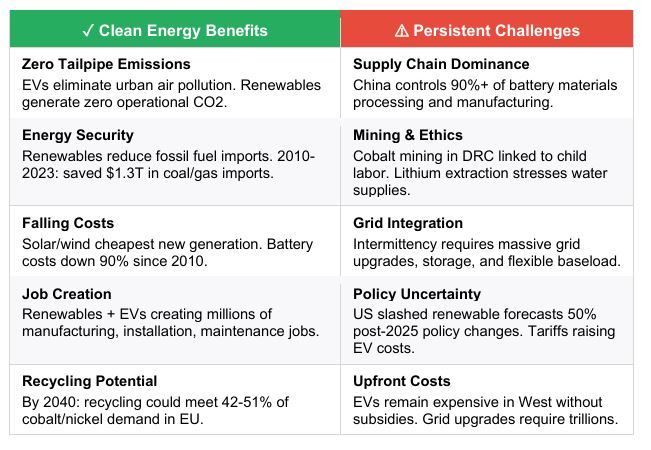
The Bottom Line: Transformation Underway, But Not Without Friction
The clean energy transition is no longer
theoretical, it's happening at scale. BYD manufactures 2.26 million EVs
annually. Solar PV capacity is doubling by 2030. Renewables are overtaking coal
as the world's largest electricity source. Battery costs have dropped 90% in a
decade. Nuclear is staging a comeback via SMRs.
But success isn't guaranteed. Supply
chains remain concentrated in China. Mining ethics are unresolved. Grids need
trillions in upgrades. Policy whiplash threatens momentum. And the transition
timeline reaching net-zero by 2050 requires doubling current deployment rates.
For ESG investors and corporate
strategists, the message is clear: The energy transition is the largest
infrastructure buildout in human history. Winners will be companies that solve
supply chain bottlenecks, scale manufacturing, and navigate policy volatility.
Losers will be those who treat sustainability as compliance theatre rather than
competitive strategy.
“The future is
electric. The future is renewable. The question isn't if, but how fast and who
captures the value along the way.”